

Creatine monohydrate is commonly offered as 80, 200 or 500 mesh. These grade names are useful for an initial comparison, but none describes the complete particle population or guarantees how a powder will run in a capsule filler, tablet press or beverage blend.
The purchasing question is therefore not “Which mesh number is highest?” It is whether the particle-size profile is measured reproducibly and matched to the finished product.
What Does a Mesh Result Actually Show?
A sieve result reports how much material passes or remains on a woven screen under defined conditions. Within the ASTM E11 sieve-designation system, No. 80, No. 200 and No. 500 correspond to nominal openings of 180, 75 and 25 μm, respectively.[1] These conversions should not be applied automatically to commercial mesh terminology unless the supplier identifies the applicable standard. A product marketed as “500 mesh” has not necessarily been demonstrated to pass a 25 μm ASTM sieve.A usable result must identify the sieve standard, nominal aperture, sample mass, agitation procedure, test time and percentage passing. ASTM E11-24 specifies sieve construction and opening tolerances; it is not a creatine acceptance specification.
Method suitability also matters. USP General Chapter <786> indicates that mechanical sieving is most suitable when the majority of particles are larger than approximately 75 μm—commonly interpreted as at least 80% of the distribution. Below this range, cohesion and adhesion may retain particles that should theoretically pass, so air-jet, sonic or another validated method may be more appropriate.[2]
Why One Passing Percentage Is Not a Distribution
Two batches can both meet “NLT 95% through 200 mesh” while containing different amounts of coarse particles, intermediate-sized particles and fines. One sieve creates one cut-off; particle-size distribution (PSD) describes the wider population.
IFor a volume-based laser-diffraction distribution, commonly reported percentile values include;
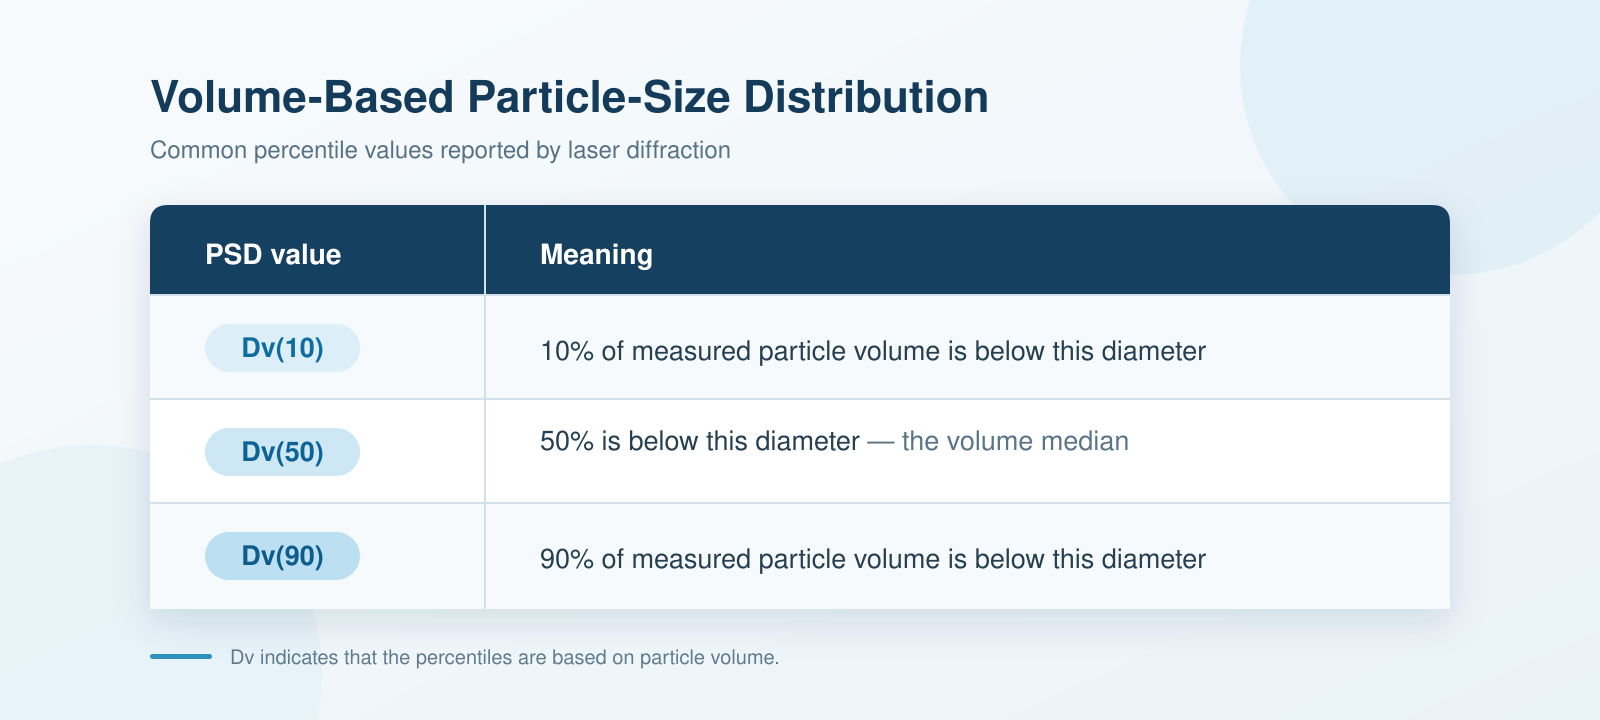
Dv(50) can remain stable while Dv(90) reveals an oversized tail or Dv(10) shows a rise in fines. Buyers should therefore avoid accepting a median alone.
Laser Diffraction Still Requires a Defined Method
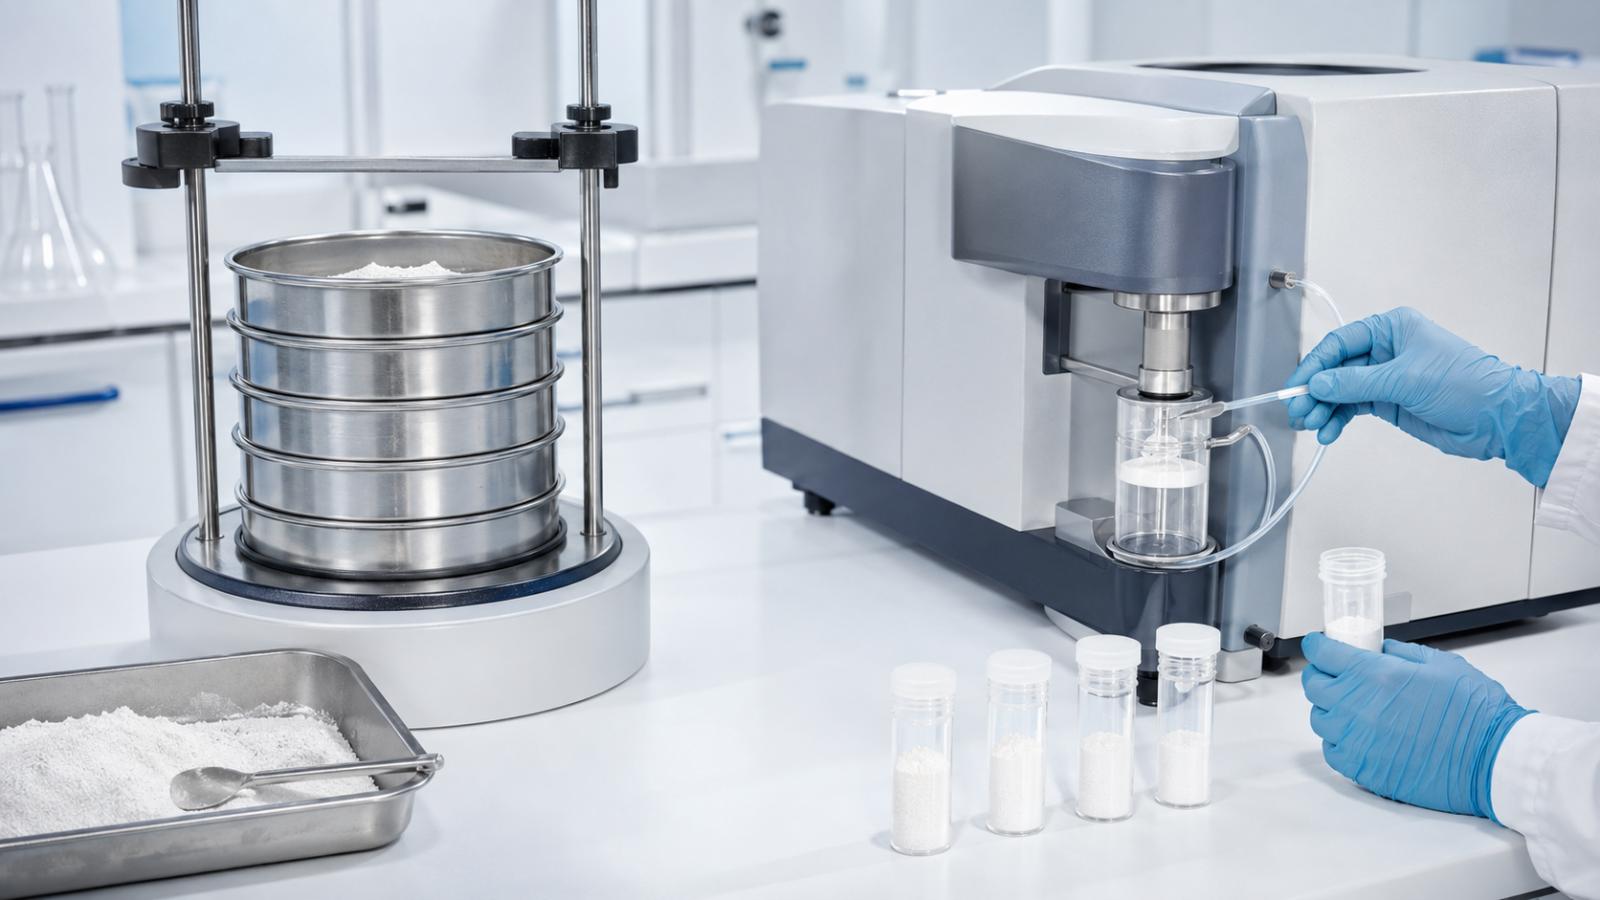
ISO 13320:2020, reviewed and confirmed in 2025, covers laser-diffraction measurements from approximately 0.1 μm to 3 mm under normal applicability conditions.[3] It derives equivalent-sphere diameters from light scattering, so its results are not interchangeable with sieve data for irregular particles.
Reports should state whether measurement was dry or wet, the dispersant, dispersion pressure or sonication conditions, obscuration range, optical model and—where applicable—particle and dispersant refractive indices and absorption settings. Weak dispersion can leave agglomerates measured as coarse particles; excessive pressure or sonication can break them and produce an artificially finer profile.
Sampling can create a larger error than the instrument.ISO 14488:2007, including Amendment 1:2019, addresses representative sampling and sample splitting for particulate-property measurements. The published standard remains current following confirmation in 2023, although ISO has marked it for revision and a replacement is under development. It addresses representative sampling and sample splitting for particulate-property measurements.[4]
Finer Creatine Is Not Automatically Better
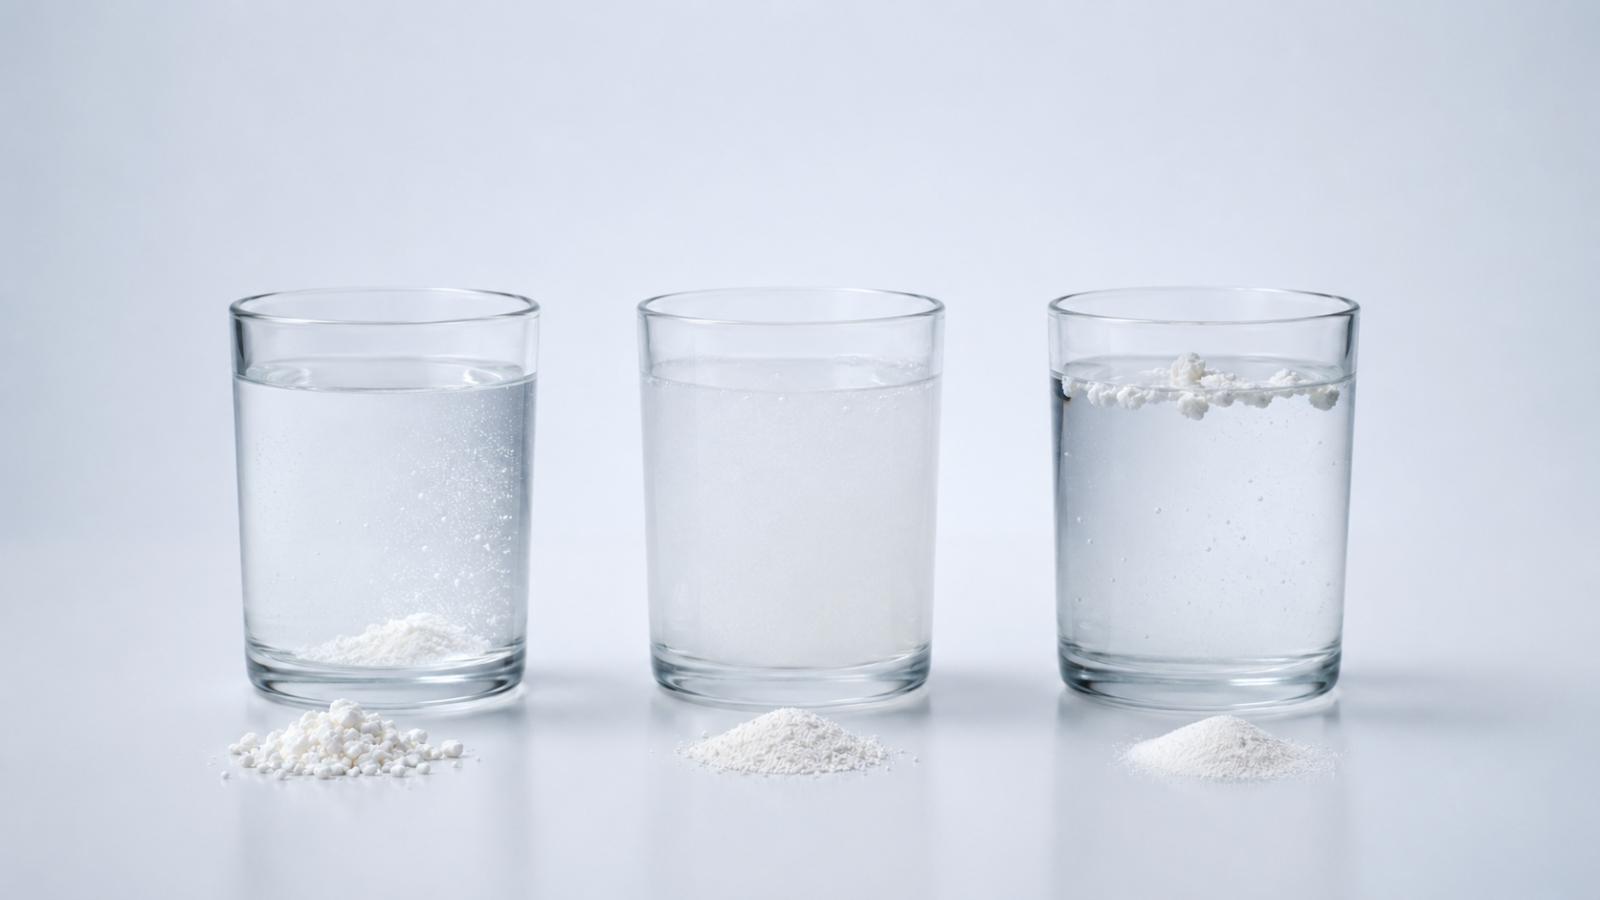
Smaller particles increase specific surface area and may reduce perceived grittiness or shorten apparent dissolution time under the same test conditions. Provided the chemical and solid-state form remains unchanged, micronisation does not increase the equilibrium solubility of creatine monohydrate or demonstrate better absorption. Very fine powder may instead show greater cohesion, dusting, agglomeration, lower bulk density or poorer flow.
A 2025 study of 410 pharmaceutical blends made from 9 APIs and 18 excipients found that flow behaviour depended on interacting features including particle size, morphology, surface properties and coating conditions.[5] The materials were not creatine, so the study cannot define a creatine limit; it supports the broader point that one mesh or median value cannot predict process performance.
Build a Method-Specific Creatine Specification
Buyers should define:
● sieve standard, aperture, test conditions and percentage passing, or full Dv(10), Dv(50) and Dv(90) limits with the laser-diffraction method;
● sampling and sample-splitting procedure;
● limits for excessive fines and oversized particles where relevant;
● bulk and tapped density plus application-appropriate flow criteria;
● batch results, change notification and confirmation in the intended equipment.
● Powder drinks may prioritise low grittiness and controlled sediment perception; capsules need repeatable density and filling; tablets need reliable feeding and compression; multi-ingredient blends must also manage segregation.
● SRS Nutrition Express supplies creatine monohydrate in different particle-size grades. Rather than treating the highest mesh number as the best grade, buyers can align sieve limits, PSD data, density and application trials with their dosage form and process.
References
1. ASTM International. ASTM E11-24: Standard Specification for Woven Wire Test Sieve Cloth and Test Sieves.
2. United States Pharmacopeia. General Chapter <786>: Particle Size Distribution Estimation by Analytical Sieving.
3. International Organization for Standardization. ISO 13320:2020—Particle Size Analysis: Laser Diffraction Methods. Reviewed and confirmed in 2025.
4. International Organization for Standardization. ISO 14488:2007—Particulate Materials: Sampling and Sample Splitting for the Determination of Particulate Properties, including Amendment 1:2019.
5. Owasit A, Tripathi S, Davé R, Young J. Predicting Powder Blend Flowability from Individual Constituent Properties Using Machine Learning. Pharmaceutical Research. 2025;42:665–683.
Post time: Aug-07-2026


